
// Tool 06
Kanban / Pull Board
Stop guessing what to make next — let what's actually being used tell you.
Waiting & delaysWhat it is and when to use it
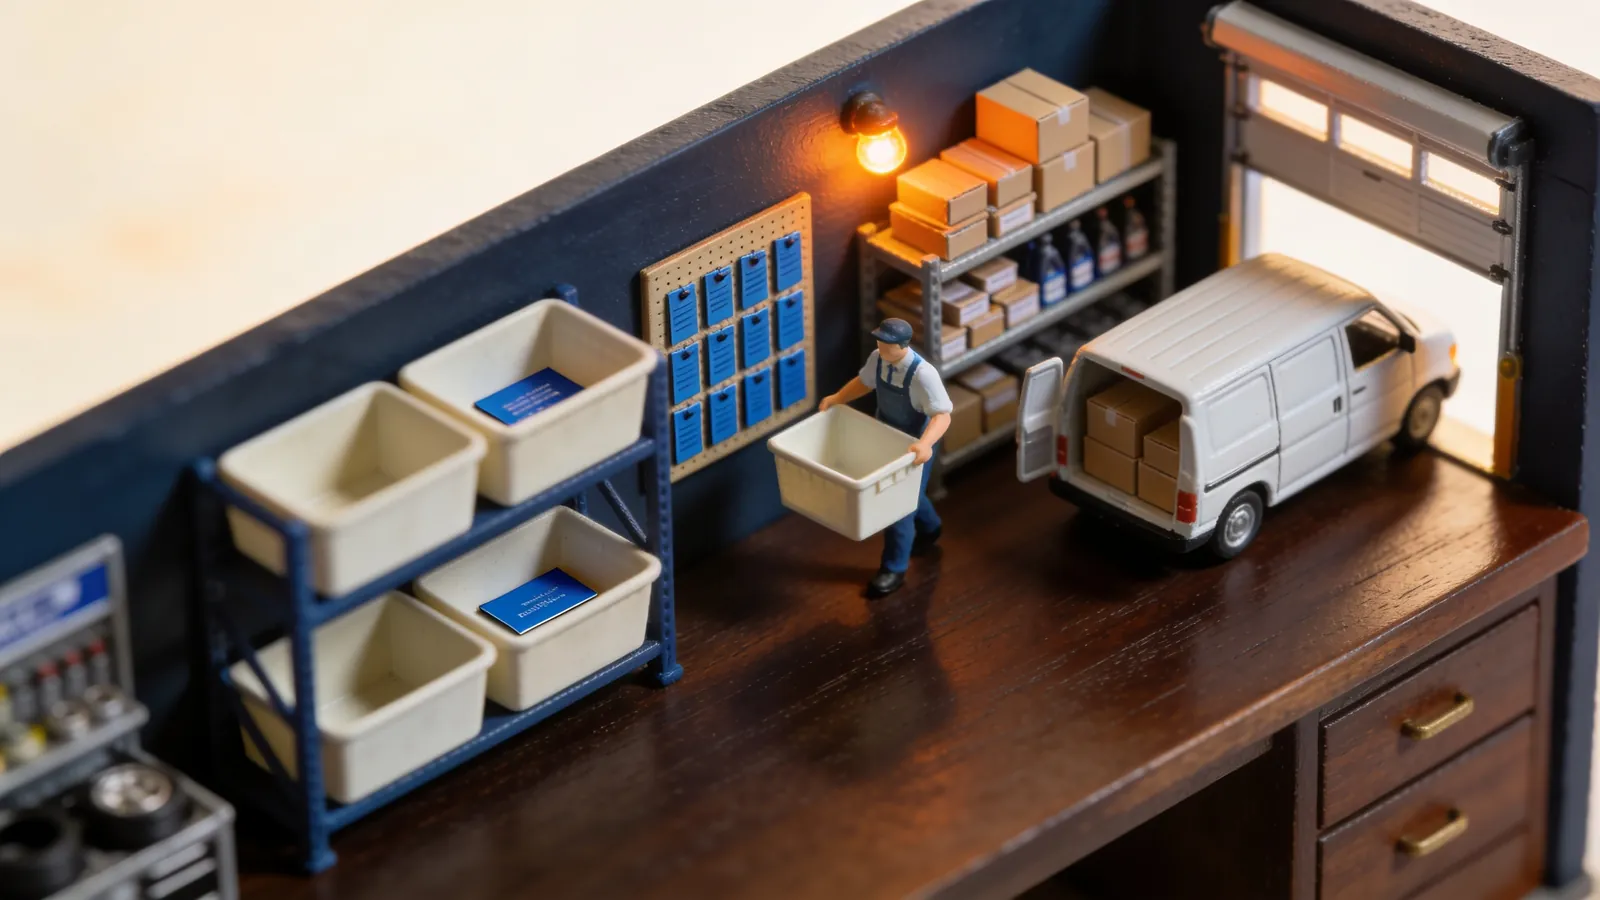
Most shops build to a forecast, then discover half of what they made is sitting in a corner while a different item runs out. A kanban board replaces that guess with a signal: nothing gets made or moved until the step downstream actually consumes it. It caps how much can pile up between any two steps and makes overproduction visible the moment it starts, instead of three weeks later when it's tying up cash on a shelf.
Worked example

Click or tap the plate to enlarge it.
What goes on the sheet
- Item/part number, and the two process steps it flows between (produced-by / consumed-by)
- Average demand per period, and its source (order history window, forecast — dated)
- Replenishment lead time for that item (measured, not assumed)
- Container/lot quantity, and safety factor applied
- Calculated card count: (avg. demand × lead time × safety factor) / container quantity
- Trigger point: inventory level or empty-bin signal that releases a card
- Review cadence: when card count gets recalculated as demand or lead time changes
In a business like yours
- Auto-parts counter: when the first bin empties, its card is the reorder — no counting, no guessing.
- Café: cups, lids and milk restocked by visual signals instead of the owner's memory.
- Contractor's shop: fittings and fasteners restocked by what jobs actually used, not bought just in case.
Illustrative examples, not client cases.
// Talk to David
This is one of the 19 tools in our loss diagnostic.
In the diagnostic we pick the ones that fit your leak and put a dollar figure on what it costs you. 30 minutes to see if it makes sense.
// Waiting & delays
Same leak
 // Tool 01
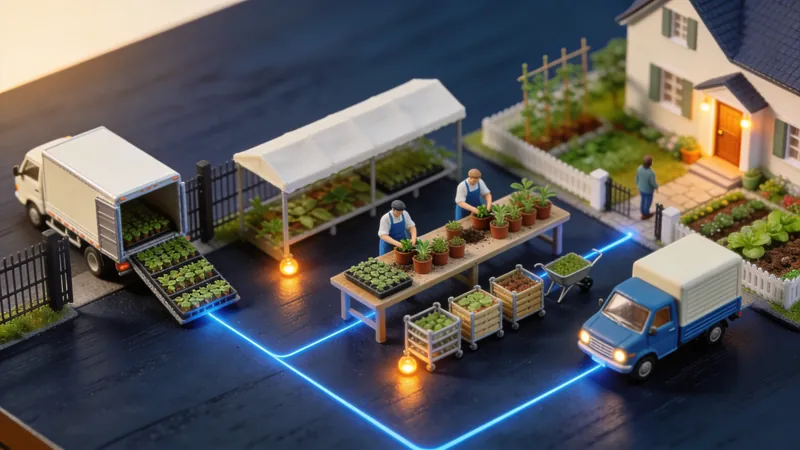
Value Stream Map (VSM)
See how much of your lead time is real work — and how much is waiting.
Waiting & delays
 // Tool 13
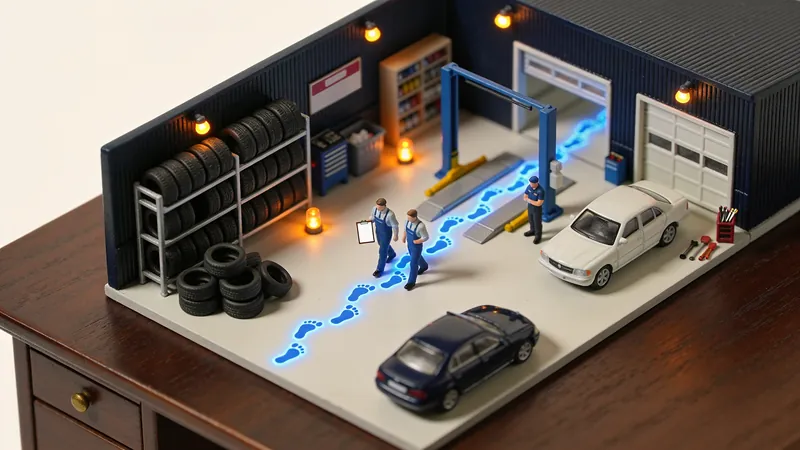
Waste Walk (7 Wastes)
Walk the same floor you walk every day — but this time, count what's actually being wasted.
Waiting & delays
 // Tool 18
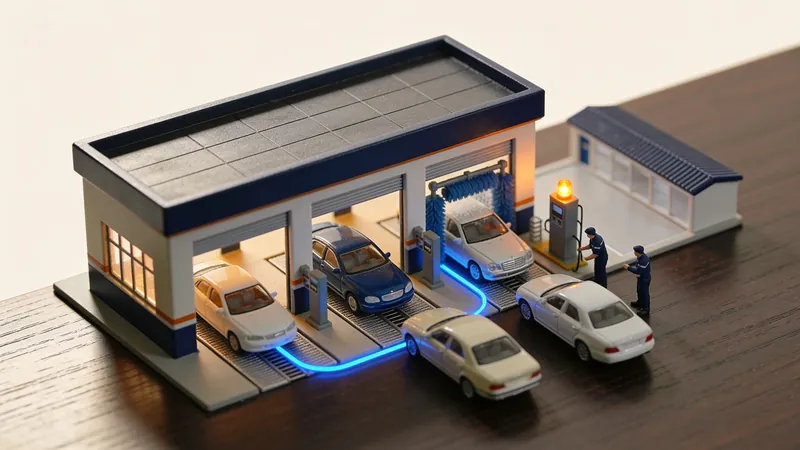
TOC Five Focusing Steps
Improving everything that isn't the bottleneck doesn't move your output — it just moves the queue.
Waiting & delays