

// Tool 01
Value Stream Map (VSM)
See how much of your lead time is real work — and how much is waiting.
Waiting & delaysWhat it is and when to use it
Most businesses don't know how much of their delivery time is actual work versus waiting, moving, or sitting in a queue. A VSM draws the full flow, from the customer's order to delivery, and separates what adds value from what doesn't — so improvement dollars go to the real bottleneck, not where the problem “feels” like it is.
Worked example

Click or tap the plate to enlarge it.
Download the blank template (PDF)One page. Print it and fill it in with your own numbers.
What goes on the sheet
- Customer/demand box: units per period, order frequency, takt-time calculation
- Supplier box: vendor, delivery frequency, lot size
- One box per process step: cycle time, changeover time, availability %, operators, shifts
- Inventory triangles between steps: quantity and days of coverage
- Information flow arrows (manual vs. electronic): orders, scheduling, forecast
- Timeline ladder: value-added time vs. wait time per stage, and totals
- Kaizen bursts marking each improvement opportunity found
In a business like yours
- Landscaping company: from signed quote to finished install, most of the days are waiting on materials and scheduling, not work.
- Bakery with wholesale orders: the dough is ready in hours, but orders sit waiting for the delivery route.
- Print shop: a 20-minute job takes three days because proofs wait in someone's inbox.
Illustrative examples, not client cases.
// Talk to David
This is one of the 19 tools in our loss diagnostic.
In the diagnostic we pick the ones that fit your leak and put a dollar figure on what it costs you. 30 minutes to see if it makes sense.
// Waiting & delays
Same leak
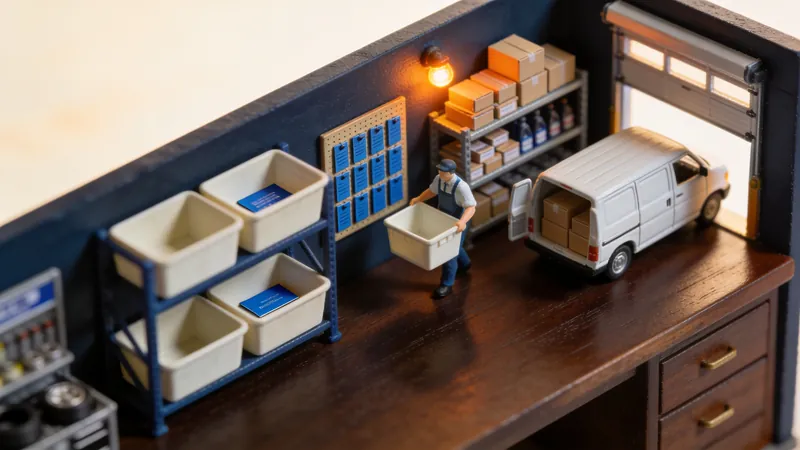 // Tool 06
Kanban / Pull Board
Stop guessing what to make next — let what's actually being used tell you.
Waiting & delays
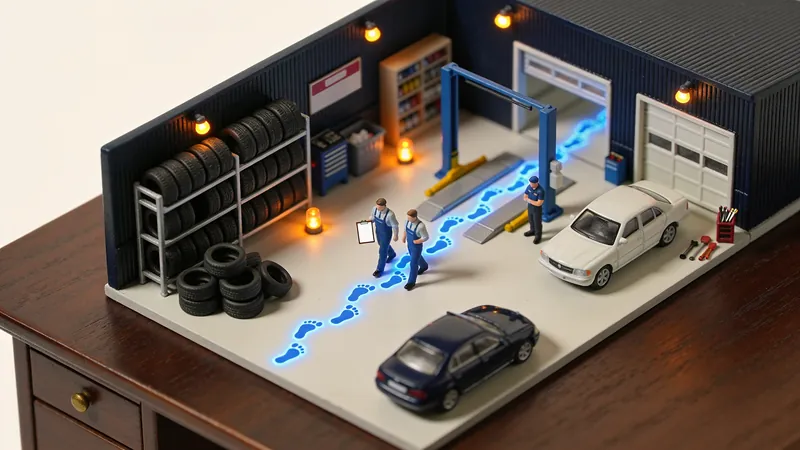 // Tool 13
Waste Walk (7 Wastes)
Walk the same floor you walk every day — but this time, count what's actually being wasted.
Waiting & delays
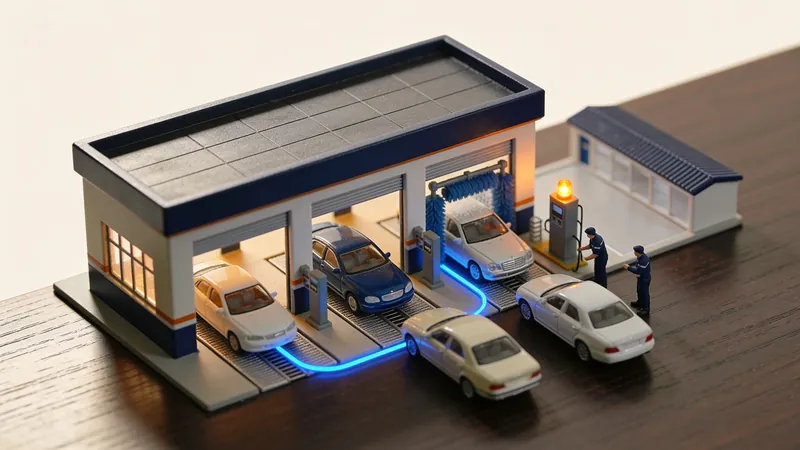 // Tool 18
TOC Five Focusing Steps
Improving everything that isn't the bottleneck doesn't move your output — it just moves the queue.
Waiting & delays