
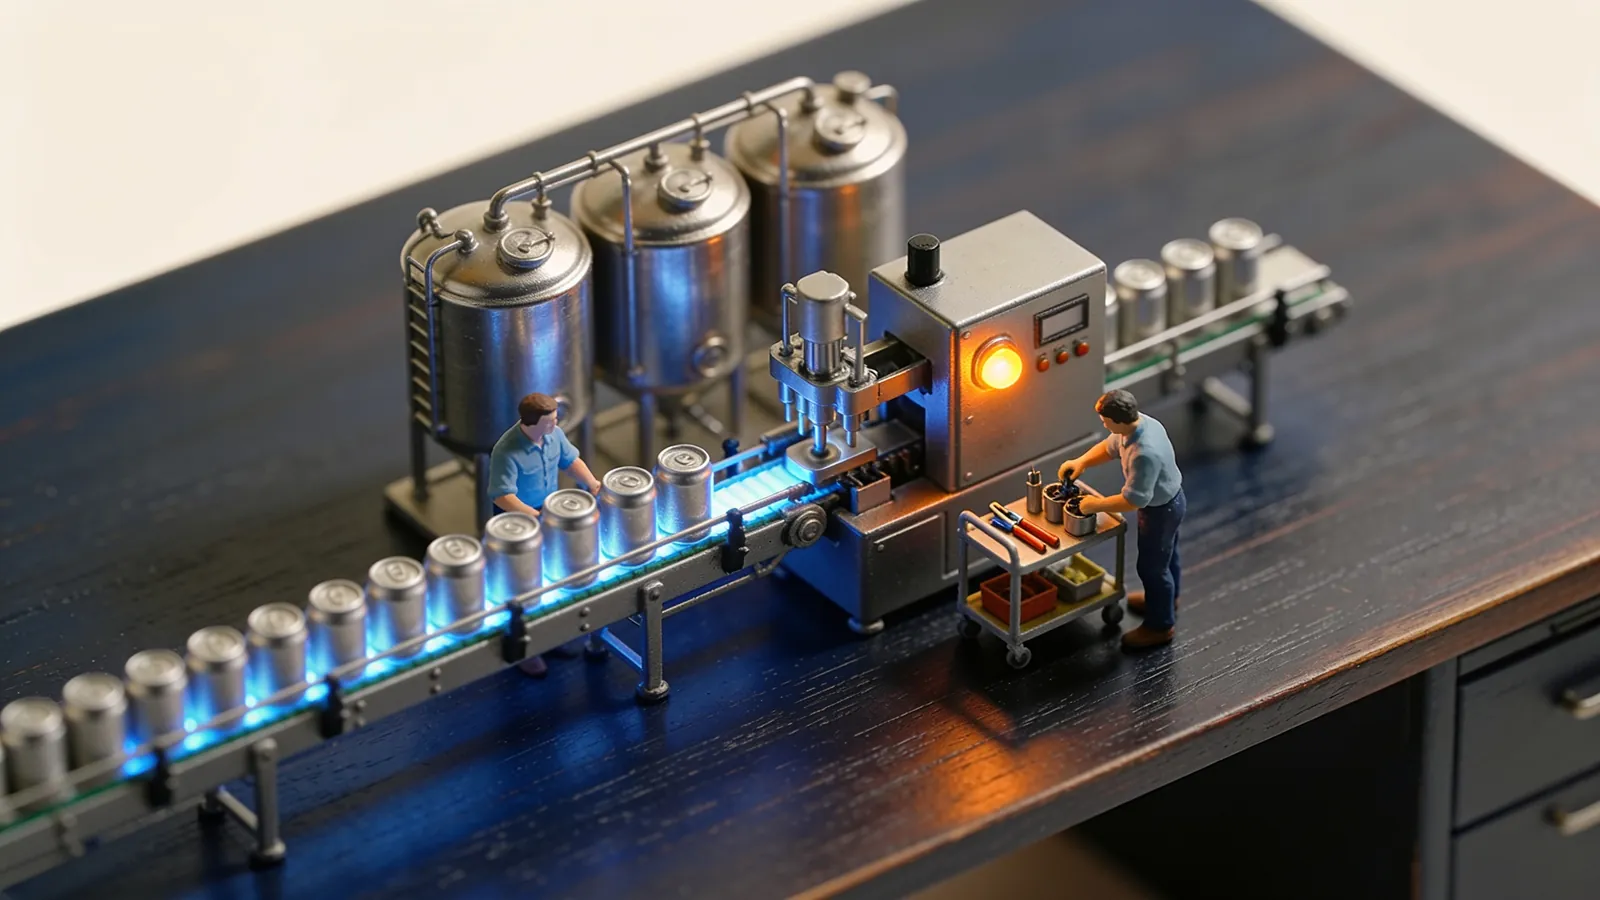
// Tool 05
OEE Dashboard
Equipment that's “on” isn't the same as equipment that's producing.
Equipment & downtimeWhat it is and when to use it
Equipment can run without ever fully stopping and still lose a large share of its real capacity to short stops, slow cycles, and defects, unnoticed. This tool turns raw shift data into one number, Availability × Performance × Quality, broken down by cause, so the decision to fix what's on the floor or invest in new equipment is made with data.
Worked example

Click or tap the plate to enlarge it.
Download the blank template (PDF)One page. Print it and fill it in with your own numbers.
What goes on the sheet
- Shift/date, equipment, planned production time
- Stop log: category (breakdown, changeover, minor stop, startup) and minutes per event
- Total parts produced, ideal cycle time, good vs. defective parts
- Calculated fields: Availability %, Performance %, Quality %, OEE % (the product of the three)
- Pareto of stop causes, ranked by minutes lost in the period
- Trend row: OEE by shift/day/week
In a business like yours
- Craft brewery: the canning line looks busy all day, but changeovers eat a big share of the shift.
- Print or sign shop: the big printer is on for eight hours; how many of them print sellable work?
- Bakery oven: availability, speed and burnt trays combined into one honest number.
Illustrative examples, not client cases.
// Talk to David
This is one of the 19 tools in our loss diagnostic.
In the diagnostic we pick the ones that fit your leak and put a dollar figure on what it costs you. 30 minutes to see if it makes sense.
// Equipment & downtime
Same leak
 // Tool 02
Autonomous Maintenance (CILR) Calendar
Most “sudden” breakdowns had a warning days earlier.
Equipment & downtime
 // Tool 12
Andon / Visual Workplace Board
A problem anyone can flag and everyone can see gets fixed today, not next month.
Equipment & downtime
 // Tool 15
SMED Changeover Worksheet
Most of a changeover's cost is sequence, not equipment — and that part is free to fix.
Equipment & downtime