
// Tool 08
Fishbone Diagram (Ishikawa)
Before you fix anything, get every possible cause on the table — not just the first one someone blames.
Mistakes & reworkWhat it is and when to use it
When something goes wrong, the fastest explanation people reach for is usually “someone made a mistake” — and that's rarely the whole story. A fishbone diagram forces a structured look across every category that could be causing the effect (method, machine, material, people, measurement, environment) before anyone commits to a fix. It's a hypothesis map, not a verdict — each branch still needs to be checked against real data before you spend money acting on it.
Worked example

Click or tap the plate to enlarge it.
What goes on the sheet
- The effect/problem statement, defined precisely (what, where, when, how much)
- Six cause categories: Method, Machine, Material, Manpower (people), Measurement, Environment — or the four adapted for service work: Policies, Procedures, People, Plant/Place
- Candidate causes listed under each category, from a group session, not one person's opinion
- For each candidate cause, whether it's verified against real data or still a hypothesis
- The 2-3 causes selected for deeper analysis (feeds directly into 5 Whys or a Pareto)
- Date and team who built it, so it can be revisited instead of redone from scratch
In a business like yours
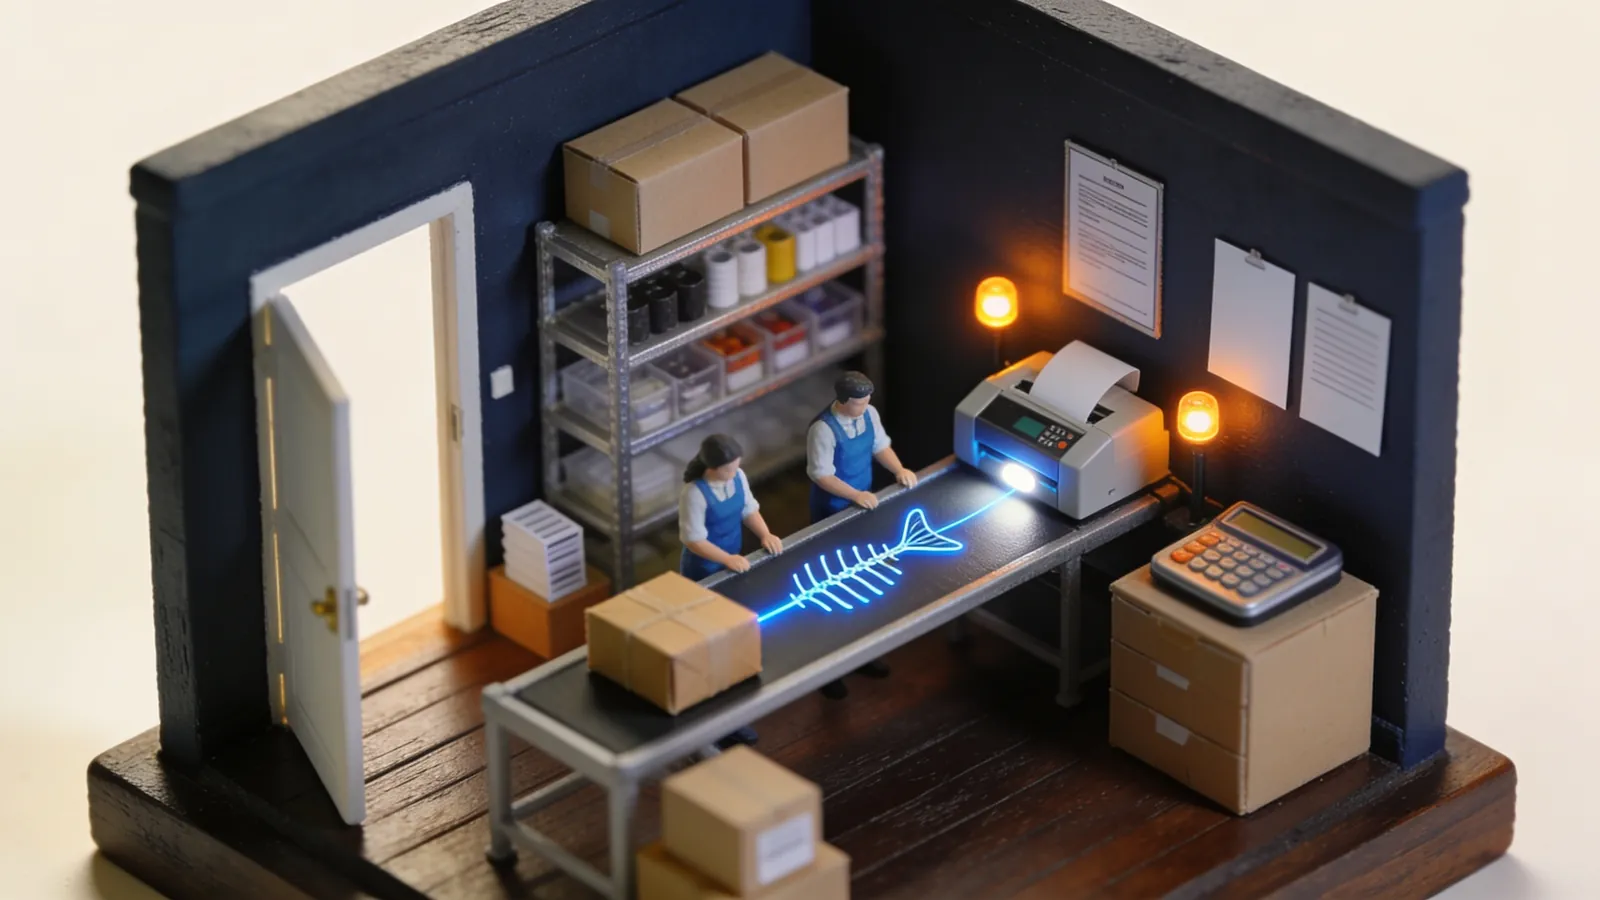
- Online shop: late orders checked against six possible causes before anyone buys a new printer.
- Restaurant: long ticket times sorted into people, equipment, method, supplies, measurement and layout.
- Roofing crew: repeat leaks after install broken down cause by cause, with evidence for each.
Illustrative examples, not client cases.
// Talk to David
This is one of the 19 tools in our loss diagnostic.
In the diagnostic we pick the ones that fit your leak and put a dollar figure on what it costs you. 30 minutes to see if it makes sense.
// Mistakes & rework
Same leak
 // Tool 09
5 Whys Root Cause Worksheet
If your last five whys all end at “the employee should have been more careful,” you didn't find the cause — you found someone to blame.
Mistakes & rework
 // Tool 10
Pareto Chart Worksheet
Most operations have one or two causes doing most of the damage — find them before you spread the budget thin.
Mistakes & rework
 // Tool 11
A3 Problem-Solving Sheet
One page that forces the thinking — not a report written after the decision was already made.
Mistakes & rework